老谢博客

  • 首页
  • WordPress
  • 网络技术
  • 乱七八糟
  • 运维技术
  • 给我留言
  • 关于老谢

搭建ELK日志系统分析处理fortigate的syslog日志

分类:运维技术日期:2020-11-13 - 13:33:23作者:老谢

  现使用的fortigate防火墙软件版本有bug导致fortiview的流量分析经常报错,但因设备托管在机房不考虑到远程升级存在风险,所以还是考虑将防火墙日志通过syslog输出给日志平台进行分析处理。

ELK简介

  ELK 不是一款软件,而是 Elasticsearch、Logstash 和 Kibana 三种软件产品的首字母缩写。这三者都是开源软件,通常配合使用,而且又先后归于 Elastic.co 公司名下,所以被简称为 ELK Stack。根据 Google Trend 的信息显示,ELK Stack 已经成为目前最流行的集中式日志解决方案。

  Elasticsearch:分布式搜索和分析引擎,具有高可伸缩、高可靠和易管理等特点。基于 Apache Lucene 构建,能对大容量的数据进行接近实时的存储、搜索和分析操作。通常被用作某些应用的基础搜索引擎,使其具有复杂的搜索功能;
  Logstash:数据收集引擎。它支持动态的从各种数据源搜集数据,并对数据进行过滤、分析、丰富、统一格式等操作,然后存储到用户指定的位置;
  Kibana:数据分析和可视化平台。通常与 Elasticsearch 配合使用,对其中数据进行搜索、分析和以统计图表的方式展示;
  Filebeat:ELK 协议栈的新成员,一个轻量级开源日志文件数据搜集器,基于 Logstash-Forwarder 源代码开发,是对它的替代。在需要采集日志数据的 server 上安装 Filebeat,并指定日志目录或日志文件后,Filebeat 就能读取数据,迅速发送到 Logstash 进行解析,亦或直接发送到 Elasticsearch 进行集中式存储和分析。

ELK部署架构

  因为现在只有1台fortigate防火墙的日志需要交给ELK处理,为方便测试学习,故将ELK组件安装在一台测试服务器上。

搭建ELK日志系统分析处理fortigate的syslog日志

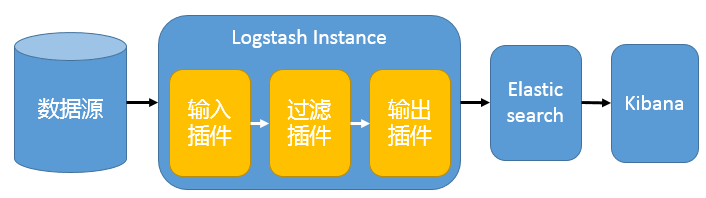
  在这种架构中,只有一个 Logstash、Elasticsearch 和 Kibana 实例。Logstash 通过输入插件从多种数据源(比如日志文件、标准输入 Stdin 等)获取数据,再经过滤插件加工数据,然后经 Elasticsearch 输出插件输出到 Elasticsearch,通过 Kibana 展示。

配置安装

ElasticSearch安装

elasticsearch依赖Java开发环境支持,先安装JDK。

yum -y install java-1.8.0-openjdk

yum -y install java-1.8.0-openjdk

查看java安装情况

java -version
 
openjdk version "1.8.0_272"
OpenJDK Runtime Environment (build 1.8.0_272-b10)
OpenJDK 64-Bit Server VM (build 25.272-b10, mixed mode)

java -version openjdk version "1.8.0_272" OpenJDK Runtime Environment (build 1.8.0_272-b10) OpenJDK 64-Bit Server VM (build 25.272-b10, mixed mode)

开始安装ElasticSearch

wget https://artifacts.elastic.co/downloads/elasticsearch/elasticsearch-6.1.0.rpm
rpm -ivh elasticsearch-6.1.0.rpm #安装后自动创建elasticsearch用户及组
mkdir -p /home/es-data #es数据存放目录
mkdir -p /home/es-logs #es日志存放目录
chown -R elasticsearch:elasticsearch /home/es-data
chown -R elasticsearch:elasticsearch /home/es-logs

wget https://artifacts.elastic.co/downloads/elasticsearch/elasticsearch-6.1.0.rpm rpm -ivh elasticsearch-6.1.0.rpm #安装后自动创建elasticsearch用户及组 mkdir -p /home/es-data #es数据存放目录 mkdir -p /home/es-logs #es日志存放目录 chown -R elasticsearch:elasticsearch /home/es-data chown -R elasticsearch:elasticsearch /home/es-logs

修改配置文件elasticsearch.yml

vim /etc/elasticsearch/elasticsearch.yml

vim /etc/elasticsearch/elasticsearch.yml

修改如下内容:

#设置data存放的路径为/home/es-data
path.data: /home/es-data
 
#设置logs日志的路径为/home/es-logs
path.logs: /home/es-logs
 
#设置内存不使用交换分区
bootstrap.memory_lock: false
#配置了bootstrap.memory_lock为true时反而会引发9200不会被监听,原因不明
 
#设置允许所有ip可以连接该elasticsearch
network.host: 0.0.0.0
 
#开启监听的端口为9200
http.port: 9200
 
#增加新的参数,为了让elasticsearch-head插件可以访问es (5.x版本,如果没有可以自己手动加)
http.cors.enabled: true
http.cors.allow-origin: "*"

#设置data存放的路径为/home/es-data path.data: /home/es-data #设置logs日志的路径为/home/es-logs path.logs: /home/es-logs #设置内存不使用交换分区 bootstrap.memory_lock: false #配置了bootstrap.memory_lock为true时反而会引发9200不会被监听,原因不明 #设置允许所有ip可以连接该elasticsearch network.host: 0.0.0.0 #开启监听的端口为9200 http.port: 9200 #增加新的参数,为了让elasticsearch-head插件可以访问es (5.x版本,如果没有可以自己手动加) http.cors.enabled: true http.cors.allow-origin: "*"

启动

systemctl start elasticsearch

systemctl start elasticsearch

查看状态

systemctl status elasticsearch

systemctl status elasticsearch

设置开机启动

systemctl enable elasticsearch

systemctl enable elasticsearch

验证运行情况

[root@localhost ~]# curl -X GET http://localhost:9200
{
  "name" : "ozNOtk_",
  "cluster_name" : "elasticsearch",
  "cluster_uuid" : "KkWwJ4SeTu-e42sKa_nZwg",
  "version" : {
    "number" : "6.1.0",
    "build_hash" : "c0c1ba0",
    "build_date" : "2017-12-12T12:32:54.550Z",
    "build_snapshot" : false,
    "lucene_version" : "7.1.0",
    "minimum_wire_compatibility_version" : "5.6.0",
    "minimum_index_compatibility_version" : "5.0.0"
  },
  "tagline" : "You Know, for Search"
}

[root@localhost ~]# curl -X GET http://localhost:9200 { "name" : "ozNOtk_", "cluster_name" : "elasticsearch", "cluster_uuid" : "KkWwJ4SeTu-e42sKa_nZwg", "version" : { "number" : "6.1.0", "build_hash" : "c0c1ba0", "build_date" : "2017-12-12T12:32:54.550Z", "build_snapshot" : false, "lucene_version" : "7.1.0", "minimum_wire_compatibility_version" : "5.6.0", "minimum_index_compatibility_version" : "5.0.0" }, "tagline" : "You Know, for Search" }

以上结果表示运行正常。

logstash安装
wget https://artifacts.elastic.co/downloads/logstash/logstash-6.1.0.rpm
rpm -ivh logstash-6.1.0.rpm
mkdir -p /home/ls-data #创建ls数据存放目录
chown -R logstash:logstash /home/ls-data 
mkdir -p /home/ls-logs #创建ls日志存放目录
chown -R logstash:logstash /home/ls-logs

wget https://artifacts.elastic.co/downloads/logstash/logstash-6.1.0.rpm rpm -ivh logstash-6.1.0.rpm mkdir -p /home/ls-data #创建ls数据存放目录 chown -R logstash:logstash /home/ls-data mkdir -p /home/ls-logs #创建ls日志存放目录 chown -R logstash:logstash /home/ls-logs

创建测试配置文件

vim /etc/logstash/conf.d/syslog.conf #新增配置文件
 
input {
 syslog {
    type => "rsyslog"
    port => "514"
  }
}
output{
  stdout{
    codec => rubydebug
  }
}

vim /etc/logstash/conf.d/syslog.conf #新增配置文件 input { syslog { type => "rsyslog" port => "514" } } output{ stdout{ codec => rubydebug } }

验证

/usr/share/logstash/bin/logstash -f /etc/logstash/conf.d/syslog.conf #此时将设备syslog日志发送至ELK服务器,注意需要关闭系统防火墙或放行514端口
 
#正常情况下,会如下收到syslog日志
 
{
        "@timestamp" => 2020-11-13T02:29:43.080Z,
           "message" => "<189>date=2020-11-13 time=10:29:43 devname=\"FG80D-OFFICE\" devid=\"FG080D3916000230\" logid=\"0000000013\" type=\"traffic\" subtype=\"forward\" level=\"notice\" vd=\"root\" eventtime=1605234583 srcip=192.168.1.5 srcname=\"Honor_Play-506a3bdd2b80af\" srcport=36584 srcintf=\"LAN\" srcintfrole=\"lan\" dstip=203.119.169.31 dstport=443 dstintf=port1 dstintfrole=\"undefined\" poluuid=\"55264c72-f728-51ea-f9c8-657401334c0c\" sessionid=2356948 proto=6 action=\"close\" policyid=1 policytype=\"policy\" service=\"HTTPS\" dstcountry=\"China\" srccountry=\"Reserved\" trandisp=\"snat\" transip=121.224.90.157 transport=36584 appid=47964 app=\"DingTalk\" appcat=\"Collaboration\" apprisk=\"elevated\" applist=\"default\" duration=782 sentbyte=5090 rcvdbyte=10772 sentpkt=48 rcvdpkt=39 utmaction=\"allow\" countapp=1 sentdelta=164 rcvddelta=84 devtype=\"Android Phone\" devcategory=\"Android Device\" osname=\"Android\" osversion=\"9\" mastersrcmac=\"00:be:3b:23:59:b6\" srcmac=\"00:be:3b:23:59:b6\" srcserver=0",
          "priority" => 0,
          "@version" => "1",
              "type" => "rsyslog",
          "severity" => 0,
              "tags" => [
        [0] "_grokparsefailure_sysloginput"
    ],
          "facility" => 0,
    "facility_label" => "kernel",
              "host" => "121.224.90.157",
    "severity_label" => "Emergency"
}
 
#如果收不到,请检查514端口占用情况
 
[root@localhost ~]# netstat -anp|grep 514
tcp6       0      0 :::514                  :::*                    LISTEN      8623/java           
udp        0      0 0.0.0.0:514             0.0.0.0:*                           8623/java

/usr/share/logstash/bin/logstash -f /etc/logstash/conf.d/syslog.conf #此时将设备syslog日志发送至ELK服务器,注意需要关闭系统防火墙或放行514端口 #正常情况下,会如下收到syslog日志 { "@timestamp" => 2020-11-13T02:29:43.080Z, "message" => "<189>date=2020-11-13 time=10:29:43 devname=\"FG80D-OFFICE\" devid=\"FG080D3916000230\" logid=\"0000000013\" type=\"traffic\" subtype=\"forward\" level=\"notice\" vd=\"root\" eventtime=1605234583 srcip=192.168.1.5 srcname=\"Honor_Play-506a3bdd2b80af\" srcport=36584 srcintf=\"LAN\" srcintfrole=\"lan\" dstip=203.119.169.31 dstport=443 dstintf=port1 dstintfrole=\"undefined\" poluuid=\"55264c72-f728-51ea-f9c8-657401334c0c\" sessionid=2356948 proto=6 action=\"close\" policyid=1 policytype=\"policy\" service=\"HTTPS\" dstcountry=\"China\" srccountry=\"Reserved\" trandisp=\"snat\" transip=121.224.90.157 transport=36584 appid=47964 app=\"DingTalk\" appcat=\"Collaboration\" apprisk=\"elevated\" applist=\"default\" duration=782 sentbyte=5090 rcvdbyte=10772 sentpkt=48 rcvdpkt=39 utmaction=\"allow\" countapp=1 sentdelta=164 rcvddelta=84 devtype=\"Android Phone\" devcategory=\"Android Device\" osname=\"Android\" osversion=\"9\" mastersrcmac=\"00:be:3b:23:59:b6\" srcmac=\"00:be:3b:23:59:b6\" srcserver=0", "priority" => 0, "@version" => "1", "type" => "rsyslog", "severity" => 0, "tags" => [ [0] "_grokparsefailure_sysloginput" ], "facility" => 0, "facility_label" => "kernel", "host" => "121.224.90.157", "severity_label" => "Emergency" } #如果收不到,请检查514端口占用情况 [root@localhost ~]# netstat -anp|grep 514 tcp6 0 0 :::514 :::* LISTEN 8623/java udp 0 0 0.0.0.0:514 0.0.0.0:* 8623/java

创建配置正式配置文件

vim /etc/logstash/conf.d/syslog.conf #删除之前的所有配置内容
 
input {
  syslog {
    type => "syslog"
    port => 514  
  }
}
 
output {
  elasticsearch {
    hosts => ["localhost:9200"]
    index => "syslog-%{+YYYY.MM.dd}"    # 数据量不大的情况下索引数量不能配置太多,否则索引和分片过多会影响性能
  }
}
 
#参考:https://jaminzhang.github.io/elk/Logstash-collect-syslog/

vim /etc/logstash/conf.d/syslog.conf #删除之前的所有配置内容 input { syslog { type => "syslog" port => 514 } } output { elasticsearch { hosts => ["localhost:9200"] index => "syslog-%{+YYYY.MM.dd}" # 数据量不大的情况下索引数量不能配置太多,否则索引和分片过多会影响性能 } } #参考:https://jaminzhang.github.io/elk/Logstash-collect-syslog/

修改logstash的启动用户(因为syslog使用514端口,在linux中小于1000的端口需要以root身份运行才能开始侦听)

vim /etc/systemd/system/logstash.service
User=root
Group=root
 
#将user和group默认的logstash改为root
 
[root@localhost ~]# netstat -anp|grep 514
tcp6       0      0 :::514                  :::*                    LISTEN      8745/java           
udp        0      0 0.0.0.0:514             0.0.0.0:*                           8745/java  
 
#踩这个坑的时候,还找到个帖子说要修改/etc/logstash/startup.options,但实际看来只用修改以上logstash.service即可。
#参考1:https://my.oschina.net/u/4275236/blog/3354332
#参考2:https://www.123admin.com/logstash-do-not-bin-port-514/

vim /etc/systemd/system/logstash.service User=root Group=root #将user和group默认的logstash改为root [root@localhost ~]# netstat -anp|grep 514 tcp6 0 0 :::514 :::* LISTEN 8745/java udp 0 0 0.0.0.0:514 0.0.0.0:* 8745/java #踩这个坑的时候,还找到个帖子说要修改/etc/logstash/startup.options,但实际看来只用修改以上logstash.service即可。 #参考1:https://my.oschina.net/u/4275236/blog/3354332 #参考2:https://www.123admin.com/logstash-do-not-bin-port-514/

配置文件测试

[root@localhost ~]# /usr/share/logstash/bin/logstash -f /etc/logstash/conf.d/syslog.conf --config.test_and_exit
 
WARNING: Could not find logstash.yml which is typically located in $LS_HOME/config or /etc/logstash. You can specify the path using --path.settings. Continuing using the defaults
Could not find log4j2 configuration at path /usr/share/logstash/config/log4j2.properties. Using default config which logs errors to the console
Configuration OK
 
#关于WARNING: Could not find logstash.yml的解决方法
 
cd /usr/share/logstash
ln -s /etc/logstash ./config
 
[root@localhost logstash]# /usr/share/logstash/bin/logstash -f /etc/logstash/conf.d/syslog.conf --config.test_and_exit
Sending Logstash's logs to /var/log/logstash which is now configured via log4j2.properties
Configuration OK

[root@localhost ~]# /usr/share/logstash/bin/logstash -f /etc/logstash/conf.d/syslog.conf --config.test_and_exit WARNING: Could not find logstash.yml which is typically located in $LS_HOME/config or /etc/logstash. You can specify the path using --path.settings. Continuing using the defaults Could not find log4j2 configuration at path /usr/share/logstash/config/log4j2.properties. Using default config which logs errors to the console Configuration OK #关于WARNING: Could not find logstash.yml的解决方法 cd /usr/share/logstash ln -s /etc/logstash ./config [root@localhost logstash]# /usr/share/logstash/bin/logstash -f /etc/logstash/conf.d/syslog.conf --config.test_and_exit Sending Logstash's logs to /var/log/logstash which is now configured via log4j2.properties Configuration OK

修改配置文件logstash.yml

vim /etc/logstash/logstash.yml
 
# 设置数据的存储路径为/home/ls-data
path.data: /home/ls-data
 
# 设置管道配置文件路径为/etc/logstash/conf.d
path.config: /etc/logstash/conf.d/*.conf
 
# 设置日志文件的存储路径为/home/ls-logs
path.logs: /home/ls-logs

vim /etc/logstash/logstash.yml # 设置数据的存储路径为/home/ls-data path.data: /home/ls-data # 设置管道配置文件路径为/etc/logstash/conf.d path.config: /etc/logstash/conf.d/*.conf # 设置日志文件的存储路径为/home/ls-logs path.logs: /home/ls-logs

启动

systemctl start logstash

systemctl start logstash

查看状态

systemctl status logstash

systemctl status logstash

设置开机启动

systemctl enable logstash

systemctl enable logstash

kibana安装
wget https://artifacts.elastic.co/downloads/kibana/kibana-6.1.0-x86_64.rpm
rpm -ivh kibana-6.1.0-x86_64.rpm
rpm -ql kibana #默认安装目录/usr/share/kibana/

wget https://artifacts.elastic.co/downloads/kibana/kibana-6.1.0-x86_64.rpm rpm -ivh kibana-6.1.0-x86_64.rpm rpm -ql kibana #默认安装目录/usr/share/kibana/

修改配置文件kibana.yml

vim /etc/kibana/kibana.yml
 
#kibana页面映射在5601端口
server.port: 5601
 
#允许所有ip访问5601端口
server.host: "0.0.0.0"
 
#elasticsearch所在的ip及监听的地址
elasticsearch.url: "http://localhost:9200"

vim /etc/kibana/kibana.yml #kibana页面映射在5601端口 server.port: 5601 #允许所有ip访问5601端口 server.host: "0.0.0.0" #elasticsearch所在的ip及监听的地址 elasticsearch.url: "http://localhost:9200"

启动

systemctl start kibana

systemctl start kibana

查看状态

systemctl status kibana

systemctl status kibana

设置开机启动

systemctl enable kibana

systemctl enable kibana

nginx安装
yum -y install epel-release
yum -y install nginx httpd-tools
cp /etc/nginx/nginx.conf /etc/nginx/nginx.conf.bak
vim /etc/nginx/nginx.conf
 
#将location配置部分,注释掉
 
        #location / {
        #}

yum -y install epel-release yum -y install nginx httpd-tools cp /etc/nginx/nginx.conf /etc/nginx/nginx.conf.bak vim /etc/nginx/nginx.conf #将location配置部分,注释掉 #location / { #}

创建kibana.conf

vim /etc/nginx/conf.d/kibana.conf
 
server {
    listen 8000; #修改端口为8000
 
    server_name kibana;
 
    #auth_basic "Restricted Access";
    #auth_basic_user_file /etc/nginx/kibana-user;
 
    location / {
        proxy_pass http://127.0.0.1:5601; #代理转发到kibana
        proxy_http_version 1.1;
        proxy_set_header Upgrade $http_upgrade;
        proxy_set_header Connection 'upgrade';
        proxy_set_header Host $host;
        proxy_cache_bypass $http_upgrade;
    }
}

vim /etc/nginx/conf.d/kibana.conf server { listen 8000; #修改端口为8000 server_name kibana; #auth_basic "Restricted Access"; #auth_basic_user_file /etc/nginx/kibana-user; location / { proxy_pass http://127.0.0.1:5601; #代理转发到kibana proxy_http_version 1.1; proxy_set_header Upgrade $http_upgrade; proxy_set_header Connection 'upgrade'; proxy_set_header Host $host; proxy_cache_bypass $http_upgrade; } }

重启nginx

systemctl restart nginx

systemctl restart nginx

ELK安装完成,来个重启

到这一步,ELK基本配置完了,输入如下命令,启动服务

# 启动ELK和nginx
systemctl restart elasticsearch logstash kibana nginx
 
#查看ELK和nginx启动状态
systemctl status elasticsearch logstash kibana nginx

# 启动ELK和nginx systemctl restart elasticsearch logstash kibana nginx #查看ELK和nginx启动状态 systemctl status elasticsearch logstash kibana nginx

以上重点感谢参考:http://www.justdojava.com/2019/08/11/elk-install/
ElasticSearch Head现已有chrome插件版,安装比较方便,请参考:https://github.com/mobz/elasticsearch-head

搭建ELK日志系统分析处理fortigate的syslog日志

fortigate的syslog日志分析与处理

太尼玛复杂了,我先慢慢研究

原文地址 : https://www.xj123.info/8119.html

本站遵循 : 署名-非商业性使用-相同方式共享 2.5 中国大陆 (CC BY-NC-SA 2.5)

版权声明 : 原创文章转载时,请务必以超链接形式标明文章原始出处

Tags: ELK , 日志
  • 上一篇:华为USG防火墙配置NAT映射回流解决内网通过公网映射访问内部服务器
  • 下一篇:Esxi6.7U3安装SanDisk Fusion-io 1.3T ioscale Pci SSD加速卡驱动
1条评论
  1. 大D 说:

    YM大佬!

    POST:2020-11-13 13:52 回复
发表评论 点击取消评论.

*必填

*必填

  • 文章归档
  • 子网计算
  • 我的共享
  • 锻炼计划
  • 给我留言
  • 关于老谢
2025 年 6 月
一 二 三 四 五 六 日
 1
2345678
9101112131415
16171819202122
23242526272829
30  
« 5 月    

最新文章

  • 认知,是否是一座大山?当架构决策变成配置清单比价
  • 重装博客服务器环境
  • 特斯拉24款标续 Model Y 2万公里使用体验
  • 接盘的傻子
  • 小牛us电瓶指示灯闪三次不上电
  • 一次还不错的小米售后体验
  • 装台1600元办公主机
  • 2021好久没更新博客
  • Zabbix监控oxidized备份状态
  • Zabbix 5.0 LTS版本MySQL表分区及编译安装随记

最新评论

  • zwwooooo:类似以前做网站开发时,一开始有自...
  • 老陳网志:有点高端,像我们整点nas玩玩就够...
  • springwood:自从 CentOS 不维护之后,我换 U...
  • 大D:难都搞下来了,那就更得YM了
  • 大D:只能是YM了,谢总牛啊
  • 灰常记忆:经济不好 今年我也换了机器 一...
  • 大峰:这是海外服务器嘛?速度挺快的。
  • 大D:只能单走一个6了哈哈哈
  • zwwooooo:买特斯拉和买iPhone的人群其实相似...
  • 平安家属子痕:一直坚持油车,看你写的心里有...

日志存档

  • 2025 年 5 月
  • 2025 年 4 月
  • 2025 年 3 月
  • 2024 年 9 月
  • 2024 年 5 月
  • 2024 年 1 月
  • 2023 年 4 月
  • 2021 年 10 月
  • 2021 年 4 月
  • 2021 年 3 月
  • 2021 年 2 月
  • 2020 年 11 月
  • 2020 年 9 月
  • 2020 年 5 月
  • 2020 年 4 月
  • 2020 年 3 月
  • 2020 年 1 月
  • 2019 年 12 月
  • 2019 年 10 月
  • 2019 年 7 月
  • 2019 年 6 月
  • 2019 年 5 月
  • 2019 年 3 月
  • 2019 年 1 月
  • 2018 年 12 月
  • 2018 年 11 月
  • 2018 年 10 月
  • 2018 年 7 月
  • 2018 年 6 月
  • 2018 年 5 月
  • 2018 年 4 月
  • 2018 年 3 月
  • 2018 年 1 月
  • 2017 年 10 月
  • 2017 年 9 月
  • 2017 年 8 月
  • 2017 年 7 月
  • 2017 年 2 月
  • 2017 年 1 月
  • 2016 年 12 月
  • 2016 年 11 月
  • 2016 年 10 月
  • 2016 年 7 月
  • 2016 年 6 月
  • 2016 年 4 月
  • 2016 年 2 月
  • 2016 年 1 月
  • 2015 年 12 月
  • 2015 年 10 月
  • 2015 年 9 月
  • 2015 年 7 月
  • 2015 年 5 月
  • 2015 年 4 月
  • 2015 年 3 月
  • 2015 年 2 月
  • 2015 年 1 月
  • 2014 年 12 月
  • 2014 年 10 月
  • 2014 年 9 月
  • 2014 年 8 月
  • 2014 年 7 月
  • 2014 年 6 月
  • 2014 年 5 月
  • 2014 年 4 月
  • 2014 年 3 月
  • 2014 年 2 月
  • 2014 年 1 月
  • 2013 年 12 月
  • 2013 年 11 月
  • 2013 年 10 月
  • 2013 年 9 月
  • 2013 年 8 月
  • 2013 年 7 月
  • 2013 年 6 月
  • 2013 年 5 月
  • 2013 年 4 月
  • 2013 年 3 月
  • 2013 年 2 月
  • 2013 年 1 月
  • 2012 年 12 月
  • 2012 年 11 月
  • 2012 年 9 月
  • 2012 年 8 月
  • 2012 年 7 月
  • 2012 年 6 月
  • 2012 年 5 月
  • 2012 年 4 月
  • 2012 年 3 月
  • 2012 年 2 月
  • 2012 年 1 月
  • 2011 年 12 月
  • 2011 年 11 月
  • 2011 年 10 月
  • 2011 年 9 月
  • 2011 年 8 月
  • 2011 年 7 月
  • 2011 年 6 月
  • 2011 年 5 月
  • 2011 年 4 月
  • 2011 年 3 月
  • 2011 年 2 月
  • 2011 年 1 月
  • 2010 年 12 月
  • 2010 年 11 月
  • 2010 年 10 月
  • 2010 年 9 月
  • 2010 年 8 月
  • 2010 年 7 月

W3C

  • XHTML 1.0 Transitional
  • CSS level 3
  • Google+
Copyright © 2010-2025 老谢博客 All rights reserved.
Gzipped 76.5% | Optimized loading 49 queries in 0.448 seconds | Memory 38.95 MB | 尼玛的备案
Powered by WordPress. | Hosted By LAOXUEHOST | Theme by WordPress主题巴士 | 站点地图 | SiteMap | uptime查询